Graphs & Tables
Reading, interpreting, and extracting information from bar graphs, line graphs, pie charts, histograms, frequency tables, two-way tables, schedules, and other structured data displays
Generate Unlimited Practice Questions
Sign up for free and get 50 practice questions to start your prep.
Start Free PracticeLearn This Topic
Imagine trying to explain your favorite video game stats using only a giant, messy wall of numbers. Boring, right? That's exactly why we have graphs! Graphs are like picture books for math. They take a bunch of confusing data and turn it into cool pictures so we can see what's going on instantly.
Bar graphs use tall buildings (bars) to compare things, like who ate the most pizza at a party 🍕. Line graphs connect the dots to show a story over time, like how tall your puppy grows each month 📈. And pie charts? They are literally sliced up like a delicious pizza to show parts of a whole!
On the ISEE, you'll get to be a data detective. You'll look at these pictures and answer questions about them. The secret is to always read the labels first! If you know what the picture is showing, the math is usually a piece of cake 🍰. Let's learn how to read these graphs like a pro so you can grab those easy points on test day!
Practice Questions
5 practice questions for ISEE Upper Level
Show Solution
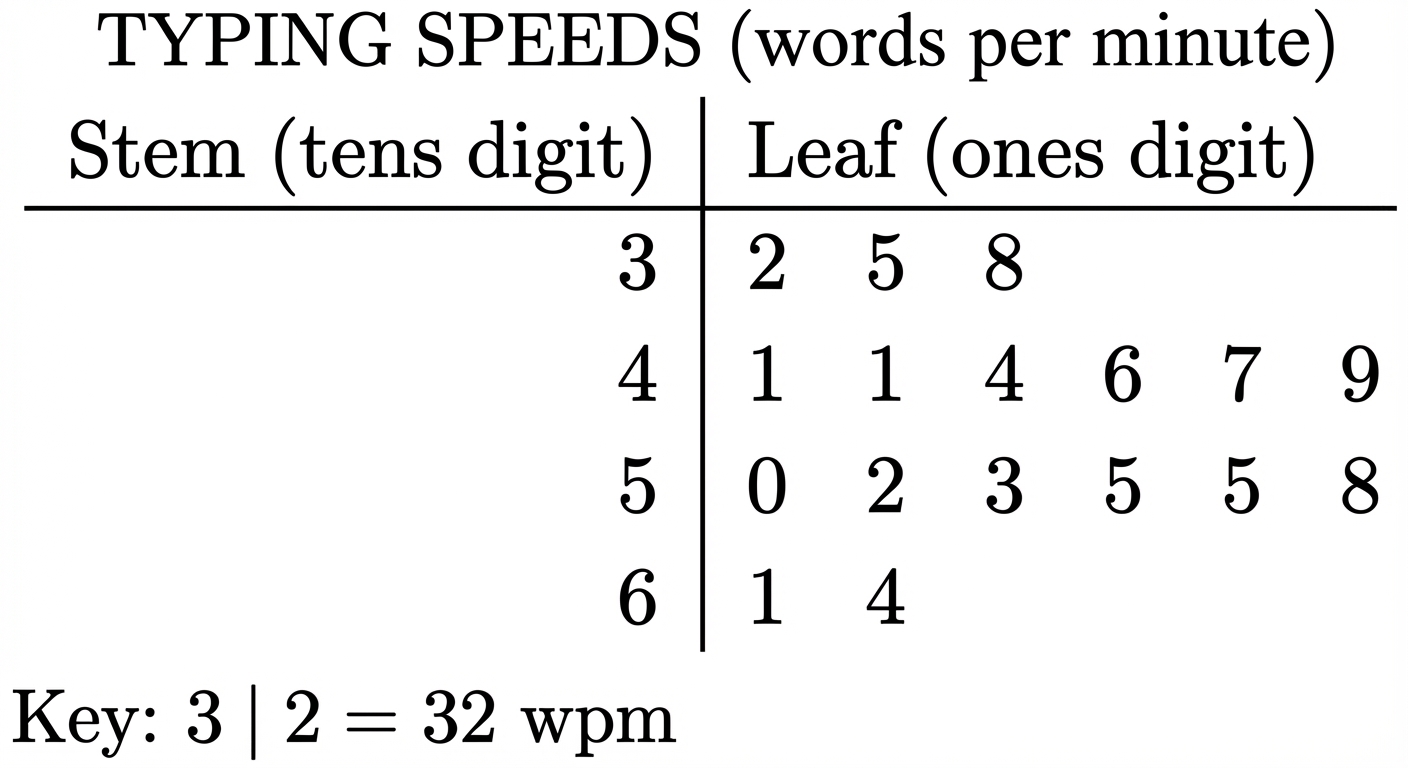
- To find the median, first determine the total number of data points. Counting the leaves, there are 3 + 6 + 6 + 2 = 17 typing speeds recorded. The median of 17 values is the middle value, which is the 9th value when ordered from least to greatest (since ). Counting from the smallest value: the '3' stem has 3 values, so the 9th value will be the 6th value in the '4' stem. The leaves for the '4' stem are 1, 1, 4, 6, 7, 9. The 6th leaf is 9, which represents a typing speed of 49. Therefore, the median is 49.
| Fruit | Number of People |
|---|---|
| Apples | 40 |
| Bananas | 35 |
| Oranges | 25 |
| Grapes | 20 |
If a circle graph is made using the data, what is the central angle of the section representing Oranges?
Show Solution
- To find the central angle of a section in a circle graph, find the fraction of the total that the section represents, and multiply by (the total number of degrees in a circle). The number of people who chose Oranges is 25 out of a total of 120 people. The central angle is . Since , the central angle is .
Show Solution
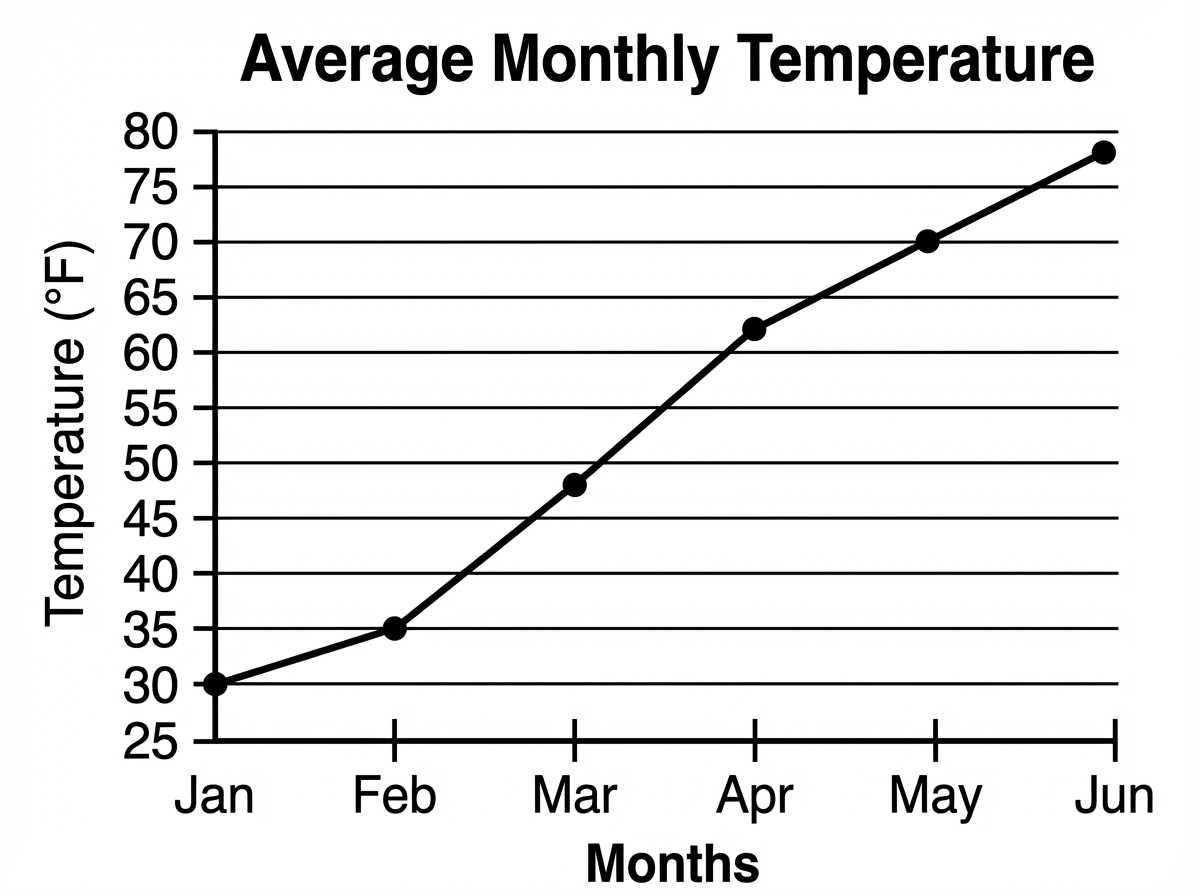
- From January to February: 35 - 30 = 5°F. February to March: 48 - 35 = 13°F. March to April: 62 - 48 = 14°F. April to May: 70 - 62 = 8°F. The greatest increase is 14°F from March to April.
| Score | Number of Students |
|---|---|
| 70 | 2 |
| 80 | 3 |
| 90 | |
| 100 | 1 |
If the mean score for the class is 84, what is the value of ?
Show Solution
- The mean is the total sum of all scores divided by the total number of students. The total number of students is . The total sum of the scores is . We are given that the mean is 84, so we can set up the equation: . Multiply both sides by to get . Distribute the 84: . Subtract from both sides: . Subtract 480 from both sides: . Divide by 6: .
Show Solution
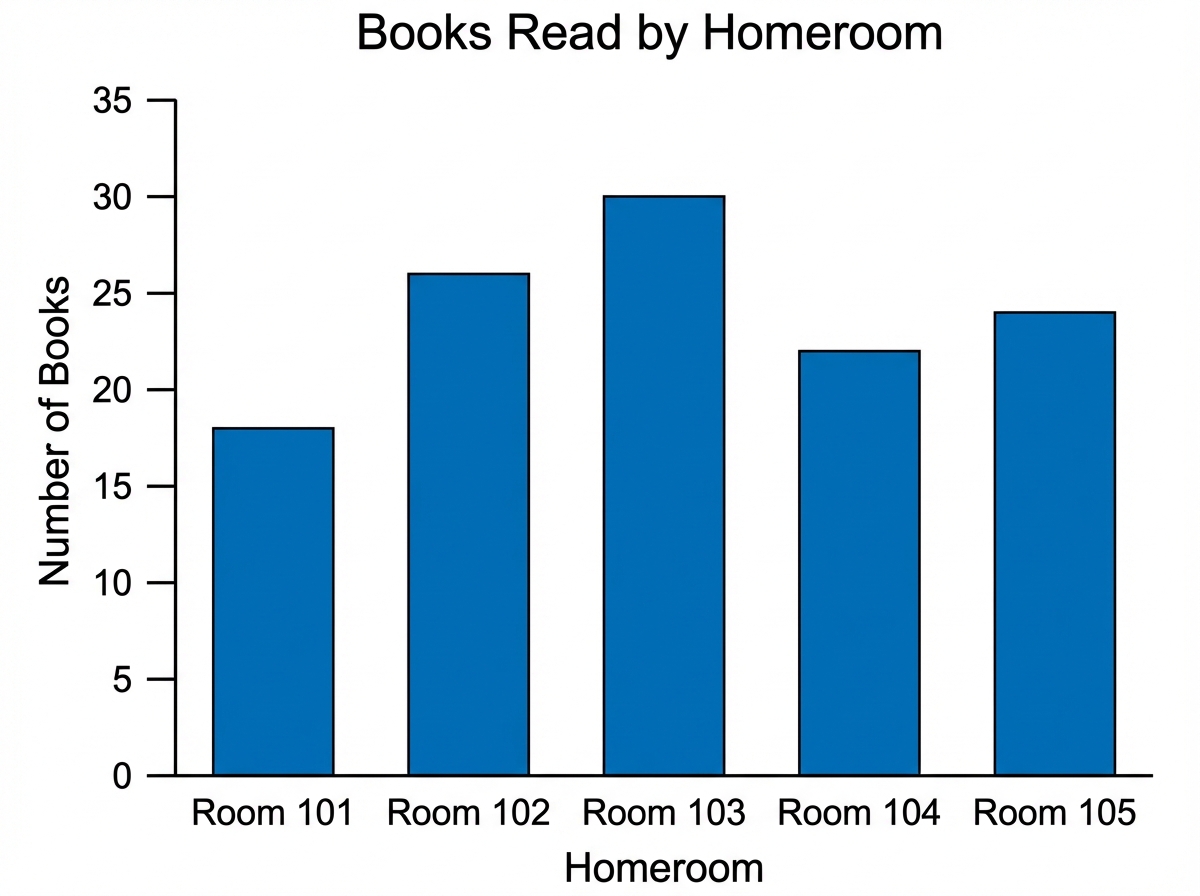
- Total books = 18 + 26 + 30 + 22 + 24 = 120. Mean = 120 / 5 = 24 books per homeroom.
Tips & Strategies
- Always read the title and labels first! The ISEE loves to trick you by changing the units. If the side of the graph says 'in thousands', the number 5 actually means 5,000.
- Use your pencil as a ruler. If a bar graph is hard to read, line up your pencil from the top of the bar straight across to the numbers on the side to see exactly where it lands.
- Pay close attention to the 'key' or 'legend'. If a pictograph shows a drawing of a book, make sure to check if one drawing equals 1 book, 5 books, or 10 books!
Common Mistakes
- Watch out for skipping the labels! A common mistake is just looking at the shape of the graph and guessing the answer without reading what the numbers actually represent.
- Don't forget that a pie chart must always add up to (or ). If you're missing a slice, just subtract all the other slices from the total to find the missing piece!
Frequently Asked Questions
Do I need to draw my own graphs on the ISEE?
Nope! The ISEE is entirely multiple-choice. You will only need to read and understand graphs that are already drawn for you.
What is a histogram? It sounds like a weird historical telegram!
Haha, it's actually just a special type of bar graph! Histograms group numbers into ranges (like ages 10-14, 15-19) and the bars touch each other to show that the numbers flow continuously without breaks.
What if I can't tell exactly where a line graph point is?
On the ISEE, the correct answer will usually be obvious enough that you can estimate safely. If a point looks exactly halfway between 10 and 20, it's safe to estimate it as 15!
Are graph questions in the Quantitative Reasoning or Mathematics Achievement section?
You can find them in both! In Quantitative Reasoning, you might compare the data in two graphs. In Mathematics Achievement, you'll usually do calculations like finding a fraction or an average from the graph.